Weekly Review
 |
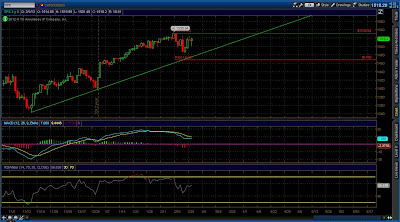
| DJIA - Daily Chart - Normal Scale |
This one is the leader of this bullish move.
It's often happen in the past, most trader see DJIA as a benchmark about how US Market perform.
While they don't see the majority of stock heading.
When DJIA break the trend line, I expect a bearish move in stock market.
 |
| SPX - Daily Chart - Normal Scale |
I expect SPX to trading range between 1470 -1530 within 2-3 weeks.
A break to either side might initiate a bigger move.
Personally I expect a break to the support.
Please check 4 hour chart on SP500 Future too,there is a down trend line still attached to the tops.
 |
| NASDAQ - Daily Chart - Normal Scale |
But NASDAQ sit at the trend line.
 |
| Russel 2000 - Daily Chart - Normal Scale |
There is a possibility to make a double top first before we move lower.
 |
| Gold Future - Daily Chart - Normal Scale |
The price held between 2 major level at 1535 as a support and 1630 as a resistance.
A break to either direction will attract trader to enter directional trader.


Comments
Post a Comment